Anthropic prices $81.34 billion IPO and debuts on Nasdaq as ANT
Anthropic priced its IPO at $83 per share. See the ANT opening-trade chart, final SEC prospectus and how the proceeds break down.
By Hypler editorial team · Source: Anthropic.
Original source date: .
Hypler publication: . Hypler updated: .
Primary source last checked: .
Source check notes
SEC final prospectus dated November 18 and issuer pricing release establish offer terms. Nasdaq confirms the November 19 listing event. Associated Press reported the opening trade at $111.50. Chart is a dated two-point comparison.
Estimated reading time: 4 minutes.
Topics: Anthropic IPO, Nasdaq ANT, IPO proceeds, AI compute infrastructure
What priced and what opened
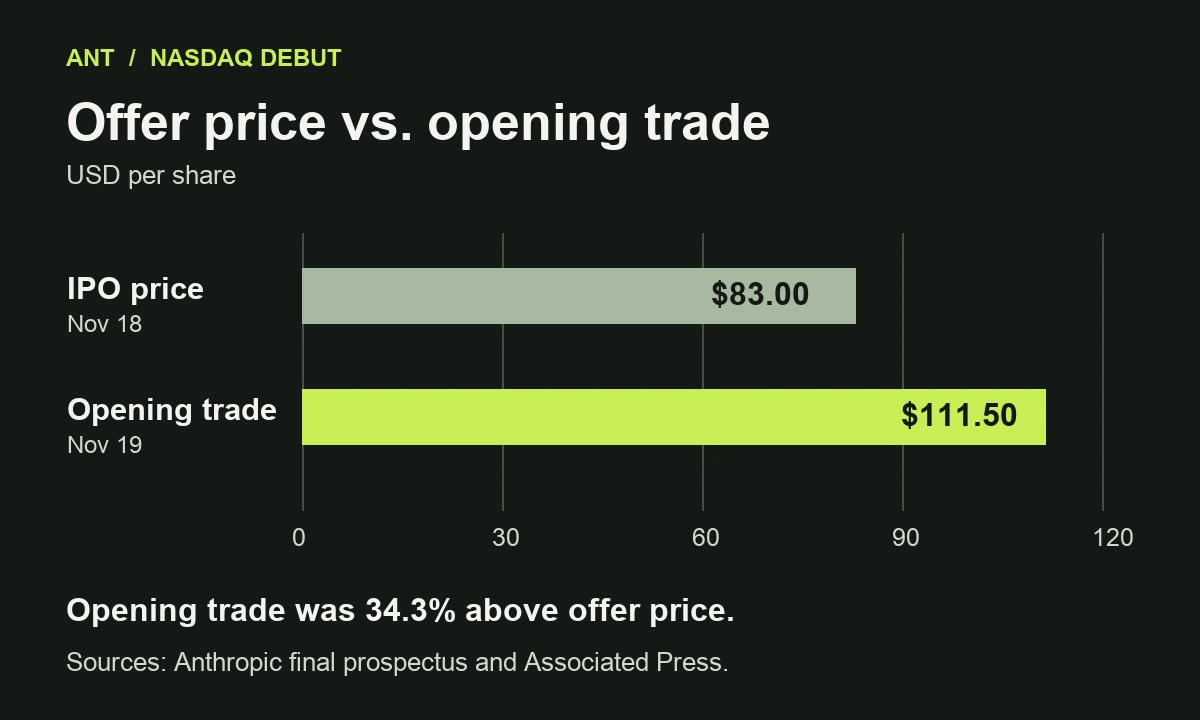
Anthropic priced 980 million Class A shares at $83 each on November 18. The final prospectus lists $81.34 billion in gross public offering value. On November 19, Nasdaq marked the listing under ANT and the Associated Press reported an opening trade at $111.50, 34.3% above the offer price. The chart compares those two observations. The offer price was set the prior evening and the opening trade reflects the first reported public execution.
The company said the offering was expected to close on November 20, subject to customary conditions. An exchange debut and settlement are separate milestones. The opening trade also captures one moment of price discovery, which can change through the session.
Where the proceeds go
The prospectus shows 956,351,354 shares offered by Anthropic and 23,648,646 by selling stockholders. After the underwriting discount and before other offering expenses, it lists roughly $78.84 billion for Anthropic and $1.95 billion for selling holders. It separately describes an approximately $26 billion concurrent private placement of Class N shares at the same per-share price. The public offering total excludes that private placement and the underwriters’ option for up to 147 million additional shares.
The distinction matters when comparing headline figures. Gross shares sold times offer price describes the public transaction. Issuer proceeds describe money going to the company, while the concurrent placement has its own terms and share class. The opening trade is a price per share on the public market and does not change the offer proceeds.
Hypler analysis — capital and delivered capacity
Anthropic identifies compute, infrastructure and hiring among intended uses of proceeds. The filing gives the company discretion over specific uses. For readers following AI infrastructure, the next evidence is what the company actually builds or secures: available compute capacity, delivery dates, power and operating costs, and how much capacity serves training versus inference. Those are separate questions from how much capital the offering brings in.
Public reporting offers a way to track those questions over time. Separate purchase commitments from cash already spent and capacity already operating. A new contract can increase future obligations before a system is ready to serve requests. Keep product reliability, security evidence and evaluation results on a separate track from financial performance.
Why the capital structure matters
The final prospectus identifies Anthropic as a Delaware public benefit corporation and describes it as a controlled company under Nasdaq corporate governance requirements. This adds a second set of questions beyond proceeds. Investors can read the governance and stock descriptions to see which rights attach to each class and how board control works. The transaction’s size does not answer who can make operating decisions or which documents govern those decisions.
The private placement includes major semiconductor and cloud firms named in the prospectus. That makes the separate placement worth reading on its own terms. A shareholder relationship, a supply contract and operating capacity are different records. Combining them can obscure a dependency that matters to customers evaluating provider concentration.
What to watch in subsequent filings
The useful follow-up is to compare disclosed commitments, changes in cash flows, and capacity actually available to customers. Capital expenditures and service commitments can have different timing and accounting treatment. Read the period and scope on each figure before comparing them. For buyers of model services, regional availability, dependable throughput and reliable failover are more direct evidence of service capability than a single day of stock trading.
Hypler analysis
Hypler’s view
The listing gives readers a public filing trail for the cost of expanding frontier AI infrastructure, from capital commitments to capacity placed into service.
Terms and definitions
- Dedicated Compute Lane
- A separate runtime path for resource-intensive work such as batch processing, model inference, or imports.
- Power Capacity
- The electrical power a facility or system can safely supply to equipment.
- NVIDIA announces Blackwell Ultra and Dynamo inference software
NVIDIA announced Blackwell Ultra, including the GB300 NVL72 and HGX B300 NVL16 systems, alongside NVIDIA Dynamo open-source inference software.
Original source
Source reporting and independently reasoned Hypler analysis are labeled in the article. Conceptual artwork supplies context. Source scope and dates are listed in the editorial record.